Real estate is hyper local, so it’s ok to listen to big picture trends on the news, but it’s super important to be dialed in to the specific towns and neighborhoods to best answer the question, how’s the market?
We looked at some key metrics into how the market is faring now that we’re halfway through the year. How is it doing compared to the beginning of the year and to this time last year from the units sold, average sale price, and list/sale ratio.
Some Key Insights: It’s true that January is historically a quieter month in the real estate market, with steam tending to pick up as the year progresses into summer months. And we can see this ring true in 2023 in the unit sales graphs below – all the local markets we looked at showed an increase in unit sales from the beginning of the year. The same can be said for all the markets in regard to average sale price, except Pewaukee, which uncharacteristically saw average sale price take a dip from January to June, with the highest average sales occurring in January, even outperforming June of 2022 before eventually edging ahead of last year at this time in June. Hartland was the only area that had an increase across the board in unit sales and average sales price, from last year to this year and for the first half of 2023.
Take a look below where we’ve captured details on the four areas in Lake Country to see how they’re faring in this summer climate. Keep in mind, to really understand how any of this data impacts you, we’d take a much more granular look at the specific neighborhoods you are interested in to provide proper guidance to help you plan for the future. With a customized report, you can decide whether to sell, buy, or improve and hold. (And we’re happy to do this at any time, we’re just a phone call, email or text away!)
Delafield
Units sold have gone up since dry January but still haven’t rebounded to last June’s levels.
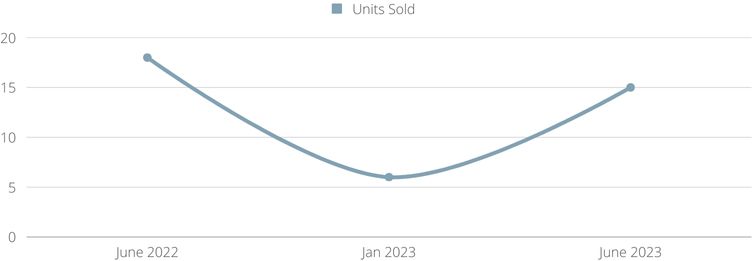
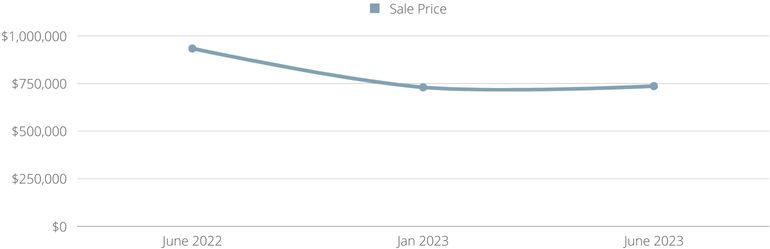
The average sale price of a home in June of 2023 in Delafield is less than it was in June of 2022, by about 21% percent and the market appears to have begun to cool. As we’re still notably in the Seller’s zone, with a Market Action Index of 59, prices have not yet adjusted. If the market continues to cool, then expect prices to follow lower. It may take a few more weeks of slack demand for prices to reflect and begin to fall. (We’ll be keeping an eye on this, when we review data for July’s report at the end of the month).
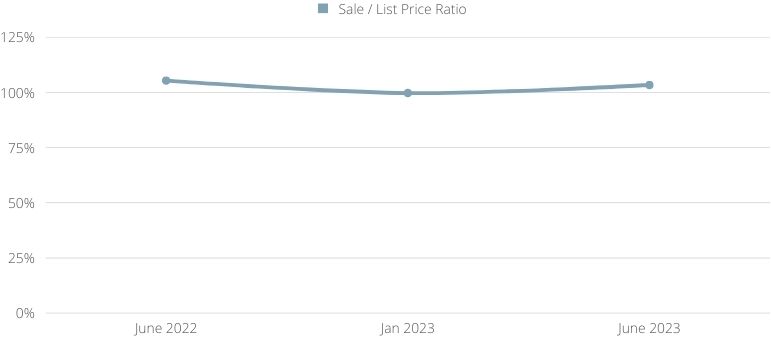
The nearly constant sale to list price ratio, despite a dip through the fall and winter months, is most likely related to the initial reaction to interest rate hikes, with a leveling off once the new normal set in.
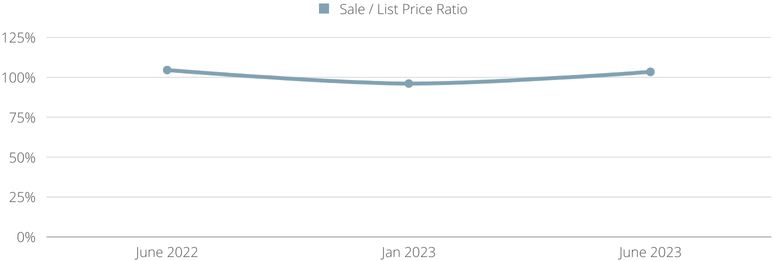
Hartland
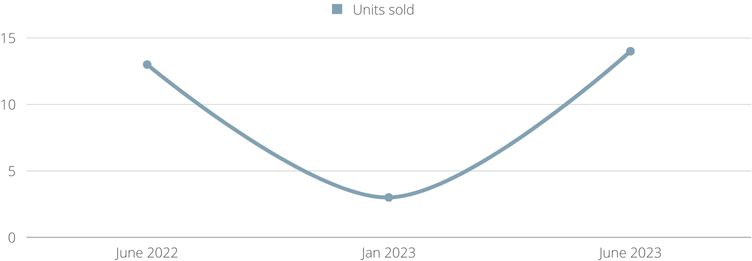
Units sold have gone up significantly since the beginning of this year, from 3 to 14 units, and has even outperformed last year at this time.
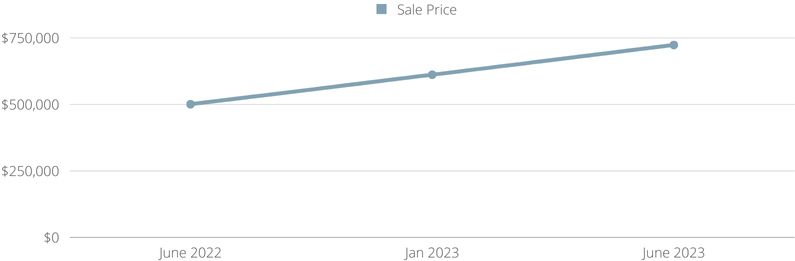
This is a more conventional trend line we’d expect to see, with the average sales price of a single-family home going up from about $500,000 in June last year to $723,000. That’s a 44% increase in sales price since June of 2022, which includes 18% just from January of this year. The Market Action Index was at 52 in June, indicating that the Hartland market continues to stay hot. More sales demand and fewer homes listed have contributed to a relatively long run of increasing prices. Current supply and demand levels show no sign of prices changing from their current trend.
Sale to List Price ratio is hovering below 100% since the start of the year, less than June 0f 2022.

Oconomowoc
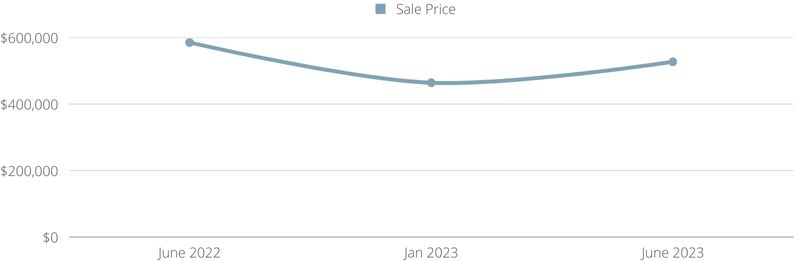
Luckily the market has recovered a bit since January, with units sold up from 17 to 29, but it hasn’t quite hit the levels that it did in 2022 around this time.
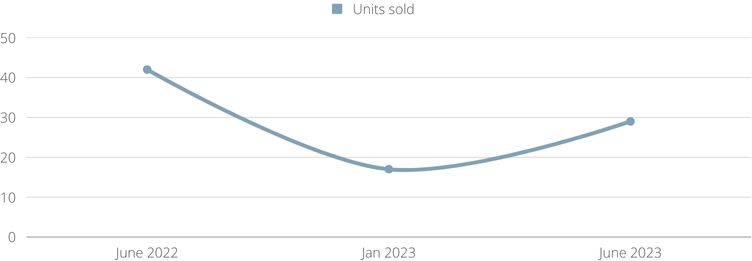
And the average sale price in Oconomowoc is still below 2022, but the market continues to get hotter. Home sales continue to outstrip supply and the Market Action Index has been moving higher for several weeks. This is a Seller’s market so watch for upward pricing pressure in the near future if the trend continues.
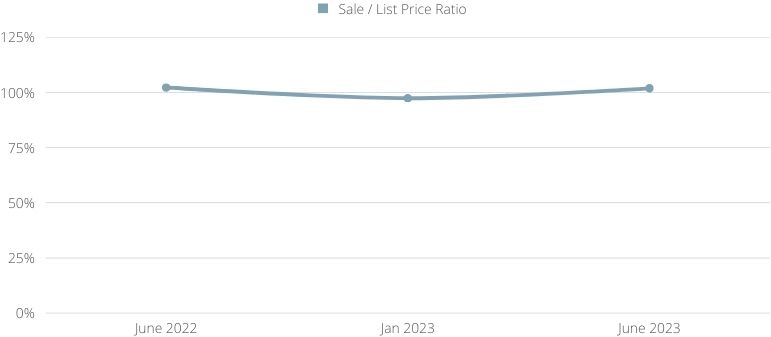
In January the sale/list price ratio dipped below 100%, but June has experienced over 100% in both years.
Pewaukee
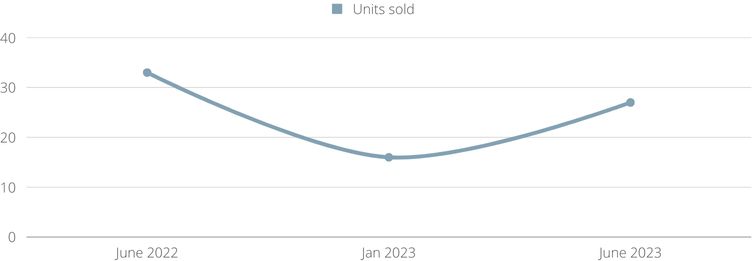
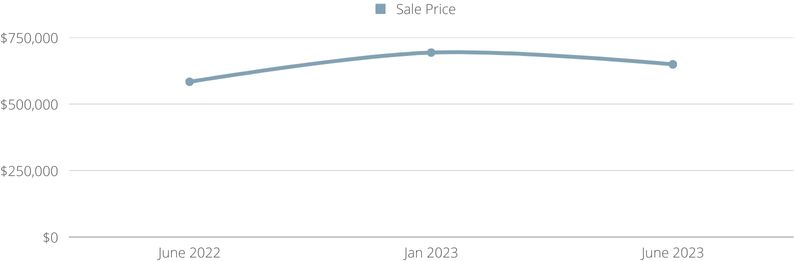
Pewaukee is showing a decrease of unit sales from June of 2022, which correlates with the higher average sales price.
The June Market Action Index of 49, but a quick look at today’s index, shows prices continuing to fall a bit. Technically supply levels indicate this is a Seller’s market so it is likely that the downward pricing pressure will be light or variable. Watch for an up-shift in the Market Area Index before price stability is achieved.
Sale to list price ratio is hovering just under June of 2022.
The median home price of a home in Waukesha County from a historical perspective, has risen steadily since 2015, from the mid $200s to the mid $400’s bolstering the perspective that real estate is one of the hardest working investments in your portfolio.